
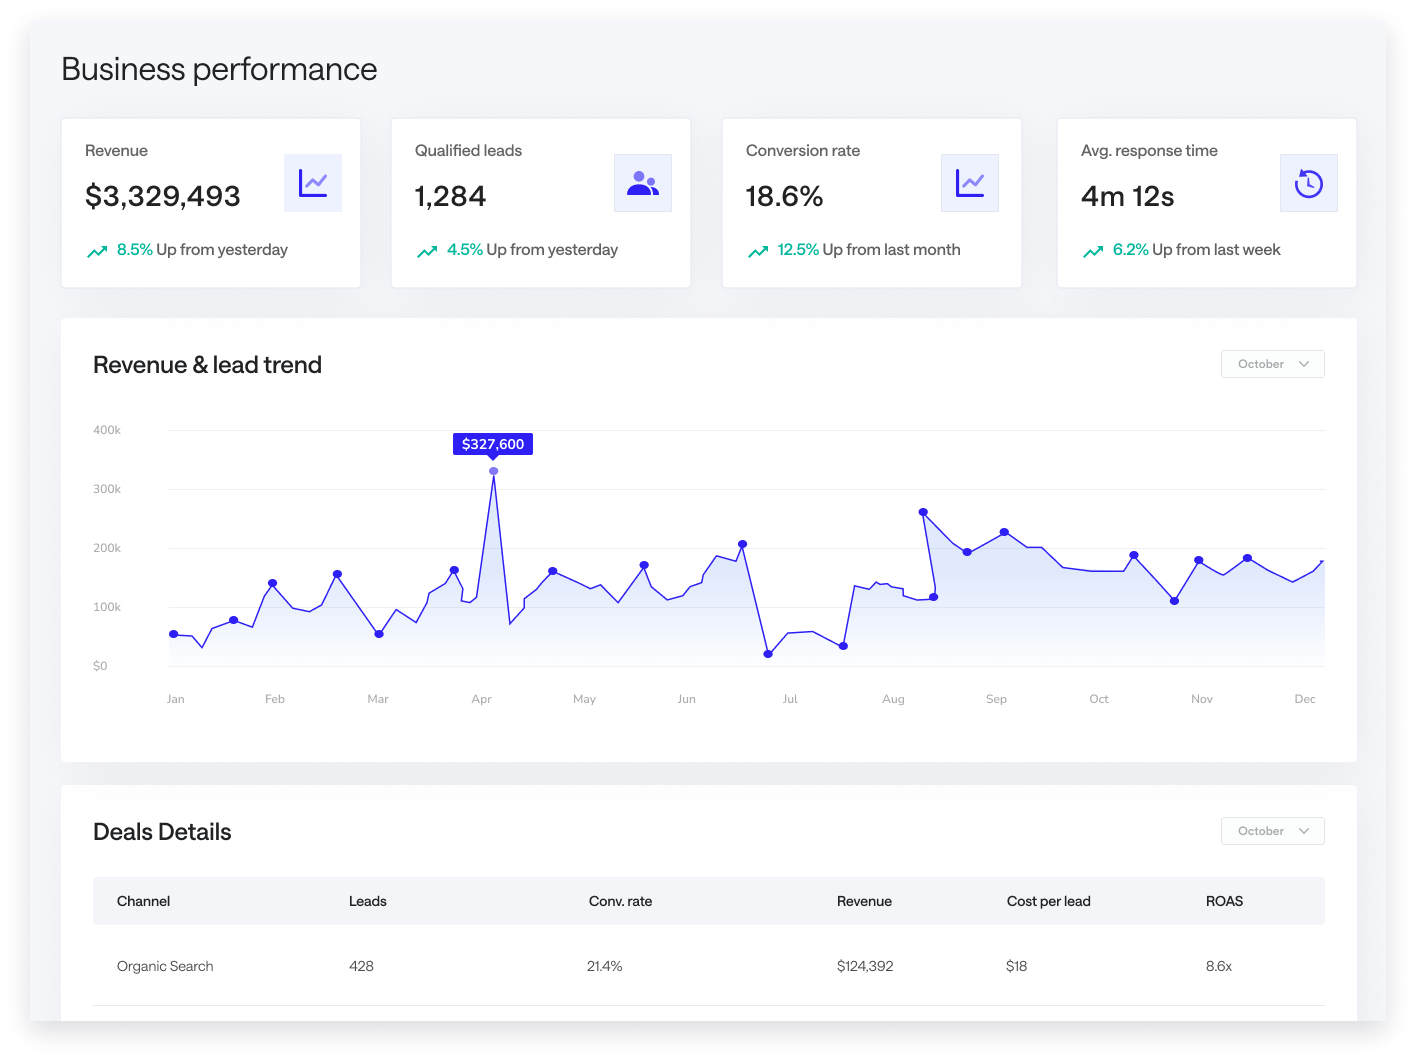
See the metrics that matter in one place
Bring key performance data into clear dashboards built around the questions your team needs answered.
Dashboards and reporting systems that make your data easier to understand and act on.We build dashboards, reporting systems, and analytics that bring your data together, surface what matters, and help your team make better decisions.














Bring key performance data into clear dashboards built around the questions your team needs answered.
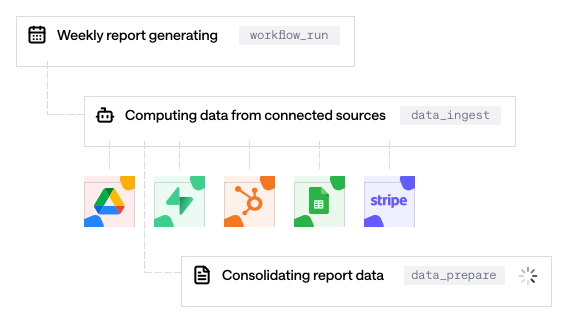
Turn recurring spreadsheets and report preparation into dependable reporting that updates with far less manual effort.
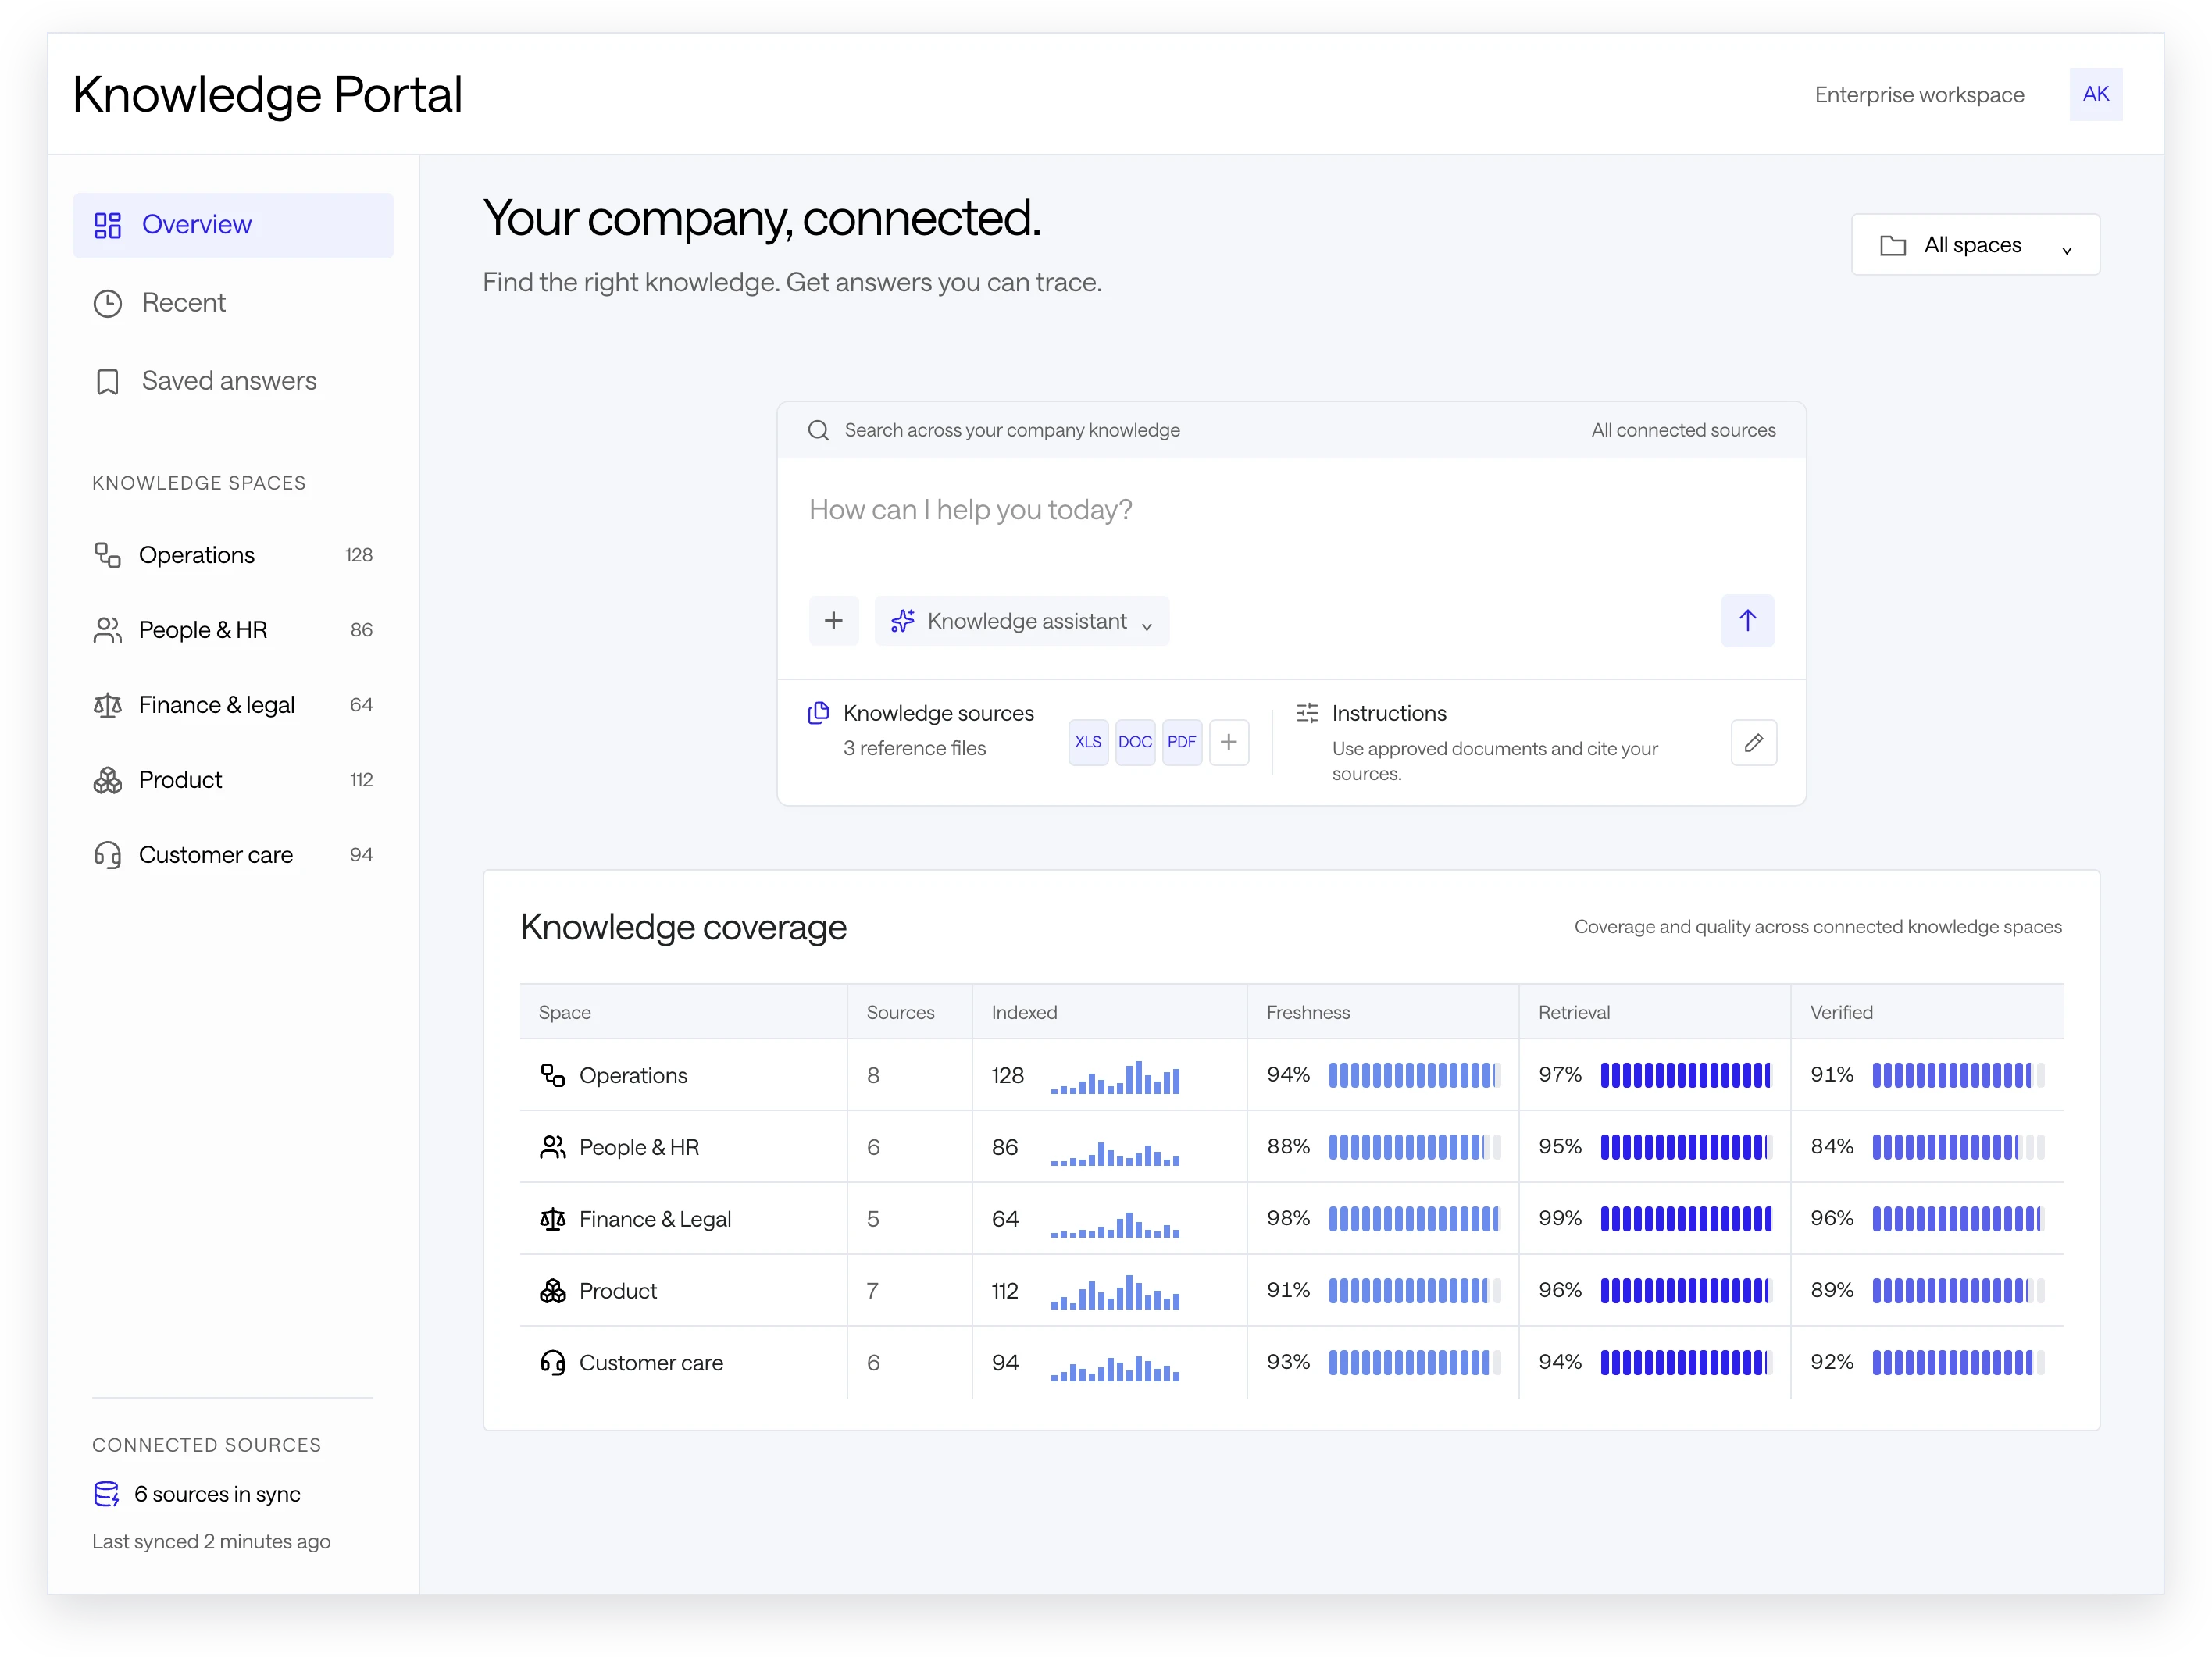
Organize documents, records, and business context so teams can find answers and information when they need it.
Turn business data into trusted metrics, clear reporting, and insights your team can actually use.
Track the metrics that matter with clear, up-to-date views of performance.
Turn complex data into reports that make trends easier to understand.
Define consistent KPIs so teams work from the same version of the truth.
Surface unusual changes and important thresholds before they get overlooked.
Give each team the information most relevant to their work and decisions.
A structured process for defining the right metrics, organizing your data, and turning it into reporting your team can trust and use.
We review your data sources, reporting needs, business questions, and the decisions your team needs to make.
We define the KPIs, calculations, dimensions, and reporting logic that should guide the system.
We structure and prepare the data so metrics remain consistent, reliable, and ready for analysis.
We design clear views around the metrics, trends, and decisions each user needs to see.
We build the dashboards and reports, then validate the numbers, logic, filters, and edge cases.
We deploy the reporting system, gather feedback, and improve it as your data and priorities evolve.
Quick answers about how we turn business data into reliable dashboards, reporting systems, and decision-ready insights.